
What is an Infographic? Examples, Templates & Design Tips
Since infographics exploded onto the graphic design scene about 15 years ago, they’ve become a staple for communication in classrooms, in the workplace, and across the web.
But if you’re new to the world of design, the term “infographic” might still be foreign to you.
You might wonder: what are infographics?
Today, I’ll give you a crash course on infographics and infographic design to answer all of your questions and more. Don’t worry if you’re no designer — I’ll also show you how you can easily customize designs with Venngage’s Infographic Maker and easy-to-edit infographic templates.
Your guide to infographics 101:
- What is an infographic?
- Why use infographics?
- 6 infographic examples for different use cases
- How do I create an infographic?
- What makes an infographic design effective?
- What are the different types of infographics?
- What is the importance of using visual elements in an infographic?
- FAQs about creating infographics
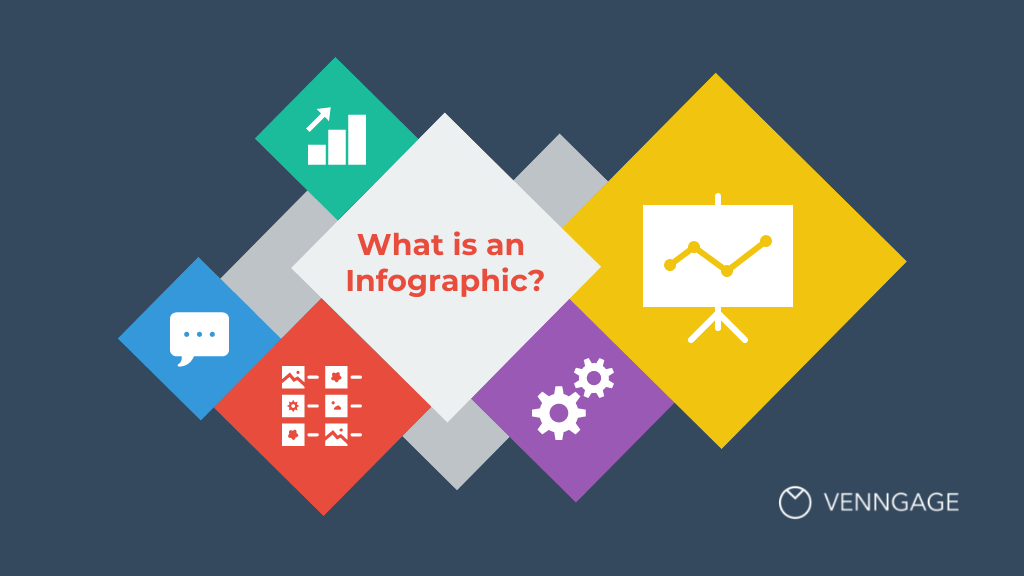
What is an infographic?
According to the Oxford English Dictionary, an infographic (or information graphic) is “a visual representation of information or data”.
But the meaning of an infographic is something much more specific.
An infographic is a collection of imagery, data visualizations including different types of charts and graphs like pie charts and bar graphs, and minimal text that gives an easy-to-understand overview of a topic.
As in the example below, infographics use striking, engaging visuals to communicate information quickly and clearly.

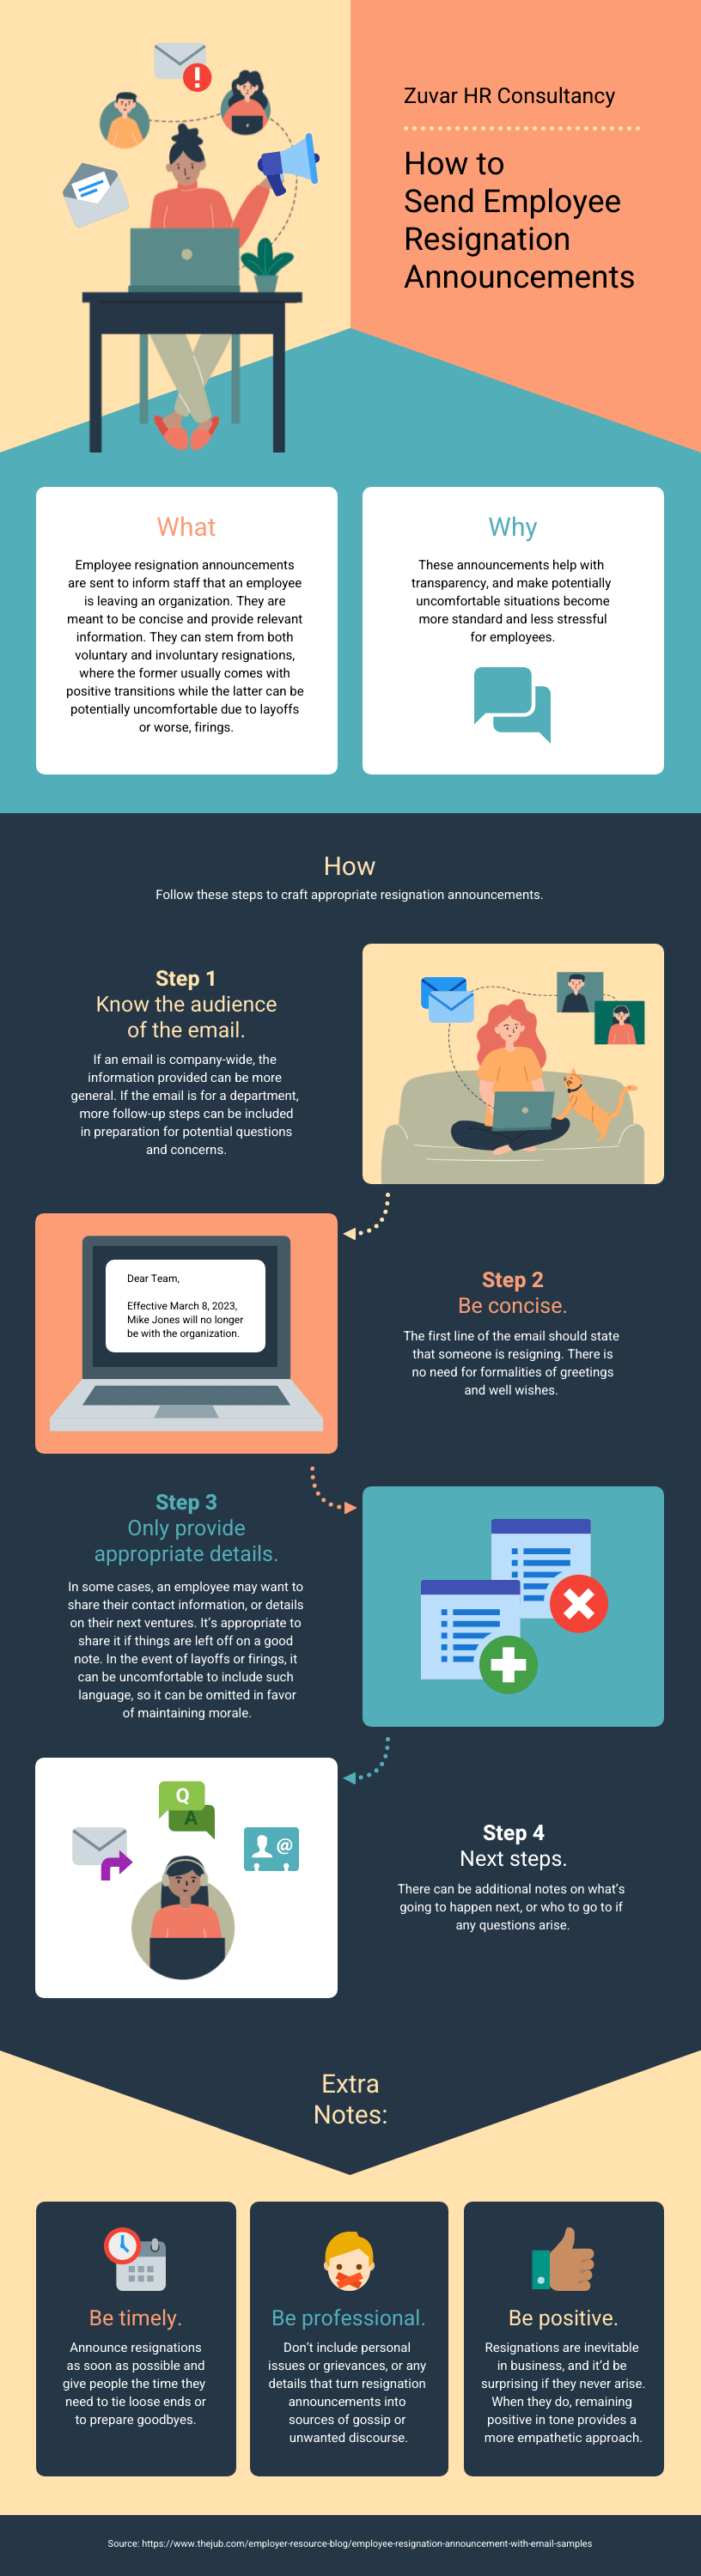
Infographics are a valuable tool for visual communication. The most visually unique, creative infographics are often the most effective because they grab our attention and don’t let go.
But it’s crucial to remember that the visuals in an infographic must do more than excite and engage.
They must help us understand and remember the content of the infographic, as seen in this infographic about employee resignation announcements:
Ready to dive right in and create your first infographic? Check out our ultimate infographic design guide for everything you need to get started.
Why should you use infographics?
Infographics are great for making complex information easy to digest. They can be helpful anytime you want to:
- Provide a quick overview of a topic
- Explain a complex process
- Display research findings or survey data
- Summarize a long blog post or report
- Compare and contrast multiple options
- Raise awareness about an issue or cause
When you need to give someone a really quick rundown on something that can be hard to explain in words alone, an infographic is a good way to go.
6 infographic examples for different use cases
Ever noticed infographics can be useful in pretty much any industry? It’s true! They can explain tough topics, show off cool data or just grab your attention, depending on what you’re after.
Here are just some of its use cases:
- Infographics for education
- Infographics for marketing
- Infographics for government
- Infographics for consulting and freelancing
- Infographics for nonprofits
- Infographics for small businesses and entrepreneurs
Education infographics
Educators and trainers use infographics to make content more memorable for students and employees:
تعليقات
إرسال تعليق